Latest News
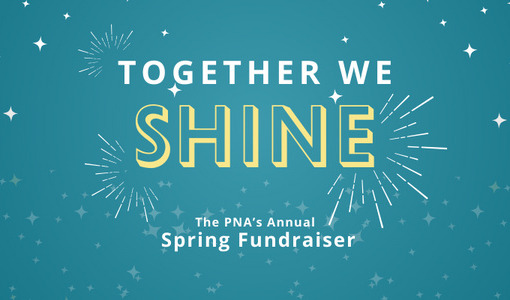
Tickets now on sale for 2024 PNA Spring Fundraiser
Ever notice the big circus tent in the Phinney Center parking lot each spring? That holds the delightful and entertaining Annual Fundraiser for the Phinney Neighborhood Association, and YOU are invited to join us on April 27 in the big tent as we shine a light on the ...

April PhinneyWood Housing Market Snapshot
This is a monthly contribution to the Blog by Greenwood realtor Doron Weisbarth Spring home sales are in full swing in our PhinneyWood neighborhood! Market activity and prices are sharply up from last year, continuing the trend that started earlier this year. ...
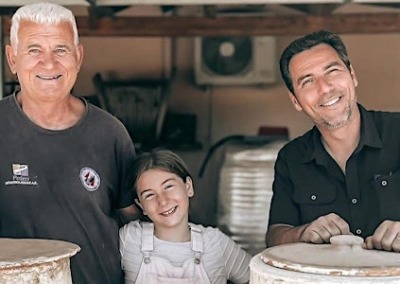
Old Phinney Ridge friend Shop Agora returns for a popup next week
Next Wednesday April 17th, Shop Agora will return to their roots and hold a pop-up from 5-7pm Phinney Ridge! Join your neighbors for an afternoon of Mediterranean snacks and Greek wine at host Doe Bay Wine Co. at 7009 Greenwood Ave N. Doe Bay owner Cole Sisson ...
Stay up to date


All Neighborhood News
Tickets now on sale for 2024 PNA Spring Fundraiser

April PhinneyWood Housing Market Snapshot
Old Phinney Ridge friend Shop Agora returns for a popup next week
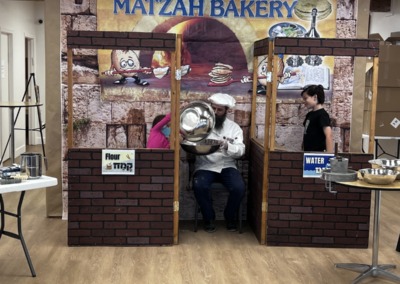
Chabad of Northwest Seattle is gearing up to host Community Passover Seder
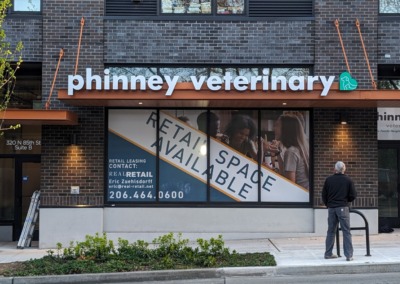
New veterinary clinic to open in PhinneyWood

Taproot Theatre offerings neighborhood discount for Summer Acting Camps

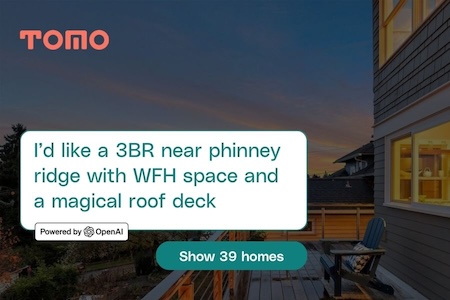
AI-powered search engine gives PhinneyWood house shoppers an edge

Ballard Preschool Co-op to host Gently Used Kids’ Gear Sale

PNA’s Holi Festival 2024: a vivid celebration of spring, community, and cultural diversity

Family kite-making workshop offered at Dabble

A stroll through Washington wines at the PNA’s Wine Taste